Reverse BMI Calculator
Calculate your BMI in reverse and find out how much weight you need to lose or gain to reach your ideal body weight with this reverse BMI calculator.
you will need to get to the weight of:
Reverse BMI Formula
Weight = (Height² x BMI) / 703.
- BMI(kg/m2) = mass(kg) / height2(m)
- BMI(kg/m2) = mass(lb) / height2(in) × 703
How do you calculate reverse BMI?
The formula is simple – instead of calculating your Body Mass Index (BMI), which is weight divided by the square of your height, you flip the equation to solve for weight. The Reverse BMI formula is:
ideal weight = (height² x BMI) / 703.
To apply the formula:
- First, determine your height.
- Next, determine your BMI.
- Finally, calculate your weight.
For example, let’s say you are 5’8″ (68 inches) and your current weight is 160 pounds. Your BMI would be 24.3. You can use the reverse formula to find out that your ideal weight is around 139 pounds. This means you would need to lose approximately 21 pounds to reach your ideal weight.
Similarly, if your BMI is below the normal range, you can use the reverse formula to find out how much weight you need to gain to reach your ideal weight.
Click here to calculate your BMI.
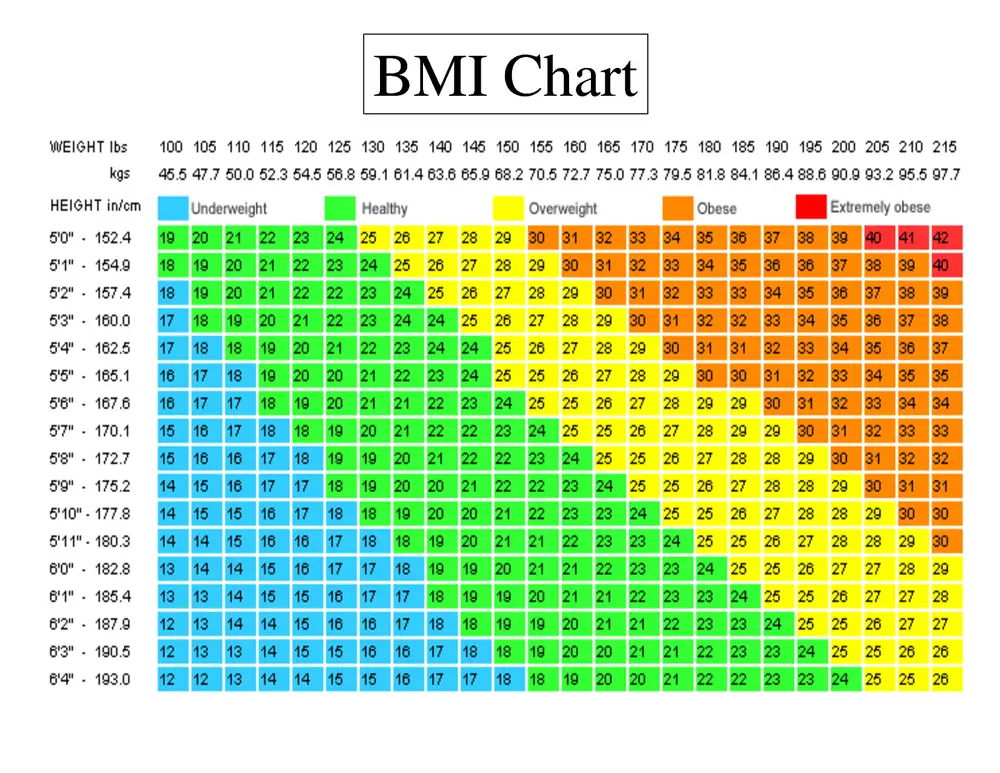
What is the correct BMI?
The body mass index (BMI) is the ratio of a person’s weight to the square of his or her height. It is used as an indicator of body fatness for most people, although it does not measure body fat directly.
| BMI Category | BMI Range (kg/m2) | Health risk |
|---|---|---|
| Underweight | 18.4 and below | Malnutrition risk |
| Normal weight | 18.5 – 24.9 | Low risk |
| Overweight | 25 – 29.9 | Enhanced risk |
| Moderately obese | 30 – 34.9 | Medium risk |
| Severely obese | 35 – 39.9 | High risk |
| Very severely obese | 40 and above | Very high risk |
What is the correct BMI by age and gender?
Mens & Womens BMI Chart
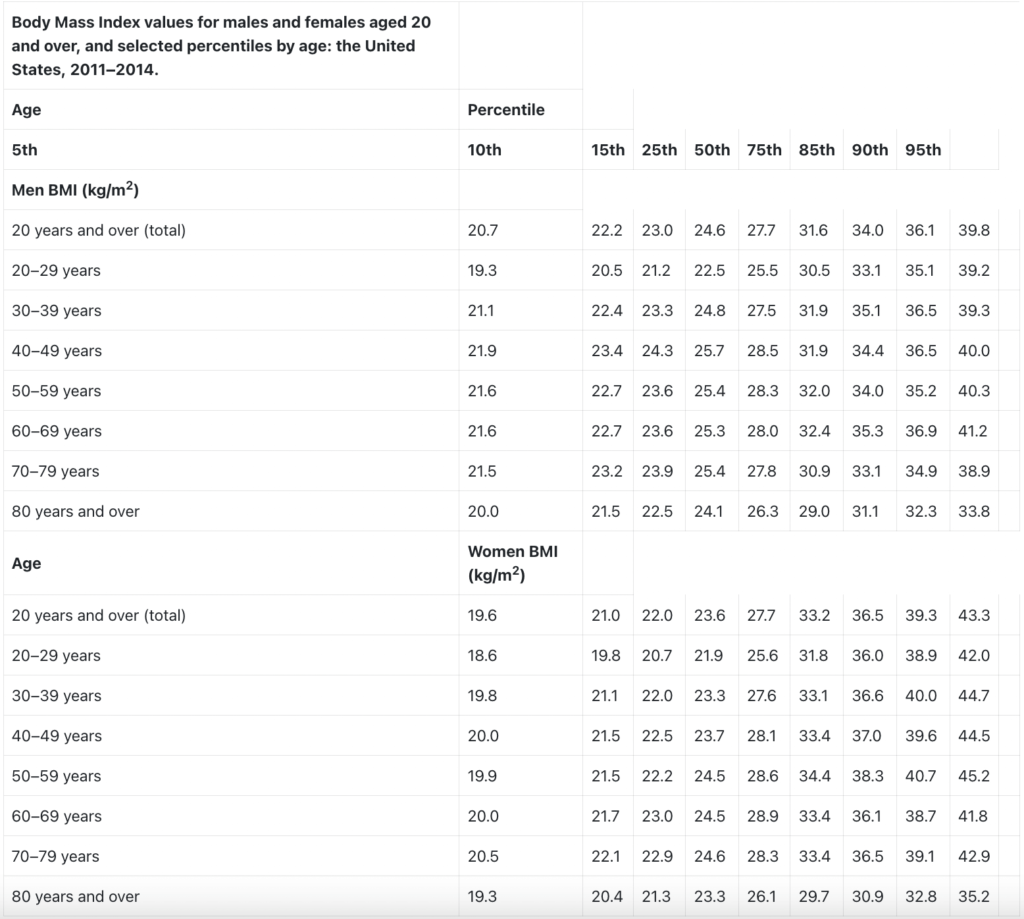
Body Mass Index values for males and females aged 20 and over, and selected percentiles by age: the United States, 2011–2014. | ||||||||||
| Age | Percentile | |||||||||
| 5th | 10th | 15th | 25th | 50th | 75th | 85th | 90th | 95th | ||
| Men BMI (kg/m2) | ||||||||||
| 20 years and over (total) | 20.7 | 22.2 | 23.0 | 24.6 | 27.7 | 31.6 | 34.0 | 36.1 | 39.8 | |
| 20–29 years | 19.3 | 20.5 | 21.2 | 22.5 | 25.5 | 30.5 | 33.1 | 35.1 | 39.2 | |
| 30–39 years | 21.1 | 22.4 | 23.3 | 24.8 | 27.5 | 31.9 | 35.1 | 36.5 | 39.3 | |
| 40–49 years | 21.9 | 23.4 | 24.3 | 25.7 | 28.5 | 31.9 | 34.4 | 36.5 | 40.0 | |
| 50–59 years | 21.6 | 22.7 | 23.6 | 25.4 | 28.3 | 32.0 | 34.0 | 35.2 | 40.3 | |
| 60–69 years | 21.6 | 22.7 | 23.6 | 25.3 | 28.0 | 32.4 | 35.3 | 36.9 | 41.2 | |
| 70–79 years | 21.5 | 23.2 | 23.9 | 25.4 | 27.8 | 30.9 | 33.1 | 34.9 | 38.9 | |
| 80 years and over | 20.0 | 21.5 | 22.5 | 24.1 | 26.3 | 29.0 | 31.1 | 32.3 | 33.8 | |
| Age | Women BMI (kg/m2) | |||||||||
| 20 years and over (total) | 19.6 | 21.0 | 22.0 | 23.6 | 27.7 | 33.2 | 36.5 | 39.3 | 43.3 | |
| 20–29 years | 18.6 | 19.8 | 20.7 | 21.9 | 25.6 | 31.8 | 36.0 | 38.9 | 42.0 | |
| 30–39 years | 19.8 | 21.1 | 22.0 | 23.3 | 27.6 | 33.1 | 36.6 | 40.0 | 44.7 | |
| 40–49 years | 20.0 | 21.5 | 22.5 | 23.7 | 28.1 | 33.4 | 37.0 | 39.6 | 44.5 | |
| 50–59 years | 19.9 | 21.5 | 22.2 | 24.5 | 28.6 | 34.4 | 38.3 | 40.7 | 45.2 | |
| 60–69 years | 20.0 | 21.7 | 23.0 | 24.5 | 28.9 | 33.4 | 36.1 | 38.7 | 41.8 | |
| 70–79 years | 20.5 | 22.1 | 22.9 | 24.6 | 28.3 | 33.4 | 36.5 | 39.1 | 42.9 | |
| 80 years and over | 19.3 | 20.4 | 21.3 | 23.3 | 26.1 | 29.7 | 30.9 | 32.8 | 35.2 |